Overview
The purpose of this portfolio is to document my contributions to IchiFund, a software engineering project under CS2103T Software Engineering module in the National University of Singapore (NUS).
IchiFund is a command-line interface (CLI) application for personal finance management. It is designed to be an all-in-one application for finance management, allowing the financially conscious Computer Science (CS) undergraduate to manage transactions, set budgets and analyse expenditure with ease and convenience.
My role was to design and implement the analytics feature of the application.
Summary of contributions
-
Major enhancement: Developed the
Model,LogicandUicomponents of the analytics feature of IchiFund.-
What it does: This feature provides deeper insights into users' incomes and expenditures, allowing users to take control of their personal finances.
-
Justification: This feature enhances IchiFund significantly because users are given a clear and concise overview of their incomes and expenditures over time and across categories using the
expenditure,income,balanceandbreakdowncommands. Without this feature, the data would be too cluttered and minimally effective at best in achieving the application’s goal of easy and convenient finance management. -
Highlights: This feature affects commands to be added in future. It required an in-depth analysis of design alternatives. Notably, the implementation was challenging as it required a thorough understanding of the existing Address Book (Level 3) (AB3) infrastructure and an overhaul of the existing code base due to the lack of similarity between existing and intended components.
-
-
Minor enhancement:
-
catrankcommand: This command allows users to view their expenditure category ranking chart. -
mthrankcommand: This command allows users to view their expenditure ranking chart by month. -
exprankcommand: This commands allows users view their expenditure ranking chart.
-
-
Code contributed: Click here to view the code I have contributed.
-
Other contributions:
-
Project management:
-
Helped manage the issue tracker
-
Helped review and merge pull requests
-
-
Enhancements to existing features:
-
Updated User Guide remove AB3 references and to be more user-friendly: #156
-
-
Documentation:
-
Updated placeholder image: #158
-
Updated the User Guide and Developer Guide
-
-
Community:
-
Contributions to the User Guide
Given below are sections I contributed to the User Guide. They showcase my ability to write documentation targeting end-users. |
Analytics
Have you ever wondered where all your money is going? Our analytics feature provides deeper insights into your incomes and expenditures, so that you can take control of your personal finances.
On startup, the analytics tab is empty.
With each analytics command entered, the analytics tab is updated with the list of command results. The image below gives an overview of the GUI of the feature:
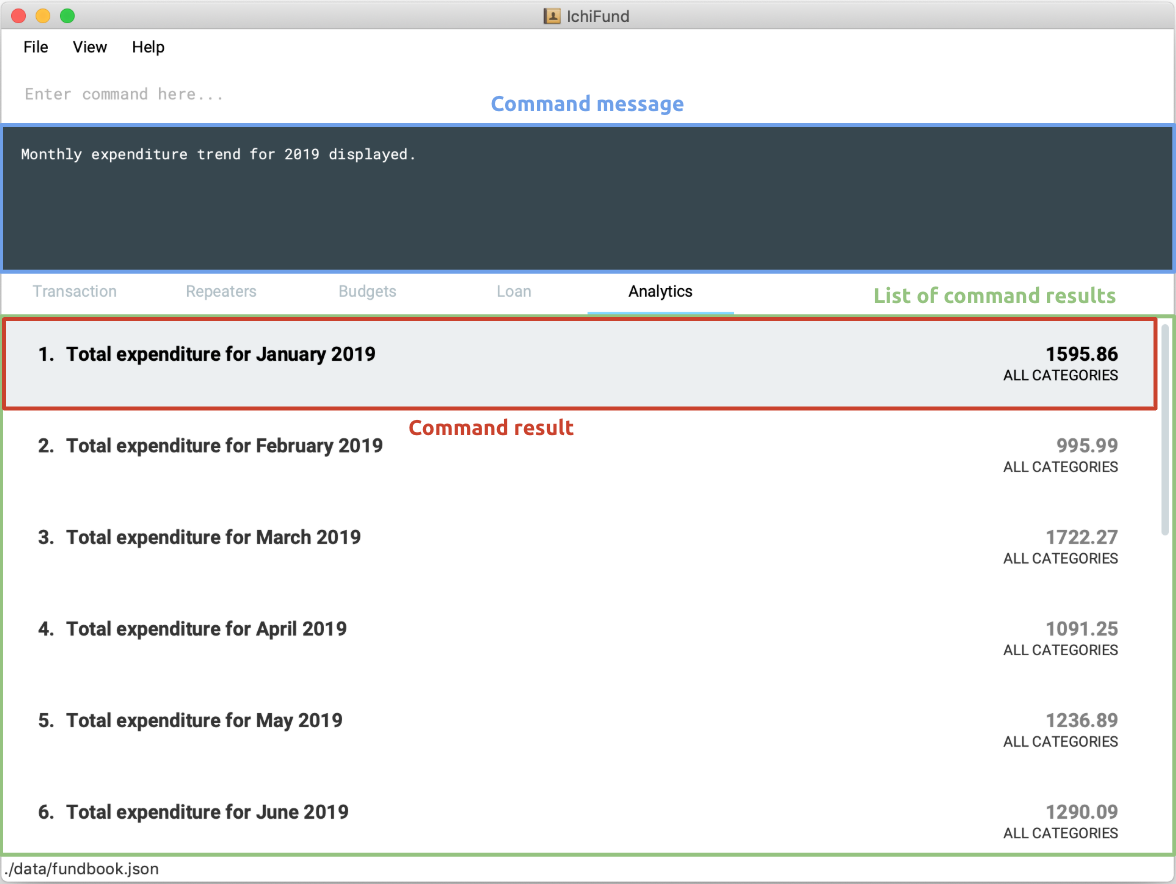
The list of command results comprises several result cells. We give a further breakdown of the information each cell displays in the following image:

For all commands in the analytics feature, if the optional arguments m/MONTH and/or y/YEAR are not provided,
results for the current month and/or year in the system time will be displayed.
|
Viewing expenditure category ranking chart: catrank
Format: catrank [m/MONTH] [y/YEAR]
What if, instead of the breakdown of your expenditure by category, i.e., breakdown, you wanted to zoom in on the top 2
largest contributing categories to your expenditure so as to cut down on your expenditure more effectively?
With the catrank command, you can take a look at your expenditure category ranking chart, and hence
be able to zoom in on and cut down on expenditure for categories that have the largest contributions to your expenditure.
| The expenditure category ranking chart is in decreasing order, i.e., the categories with higher expenditure will be at the top of the list, and the categories with lower expenditure will be at the bottom of the list. |
As the month comes to a close, you realise that you have transactions from many categories, and running the breakdown command
returns you a view that is too cluttered for your liking.
After you enter the catrank command, and the GUI of IchiFund may look like this:
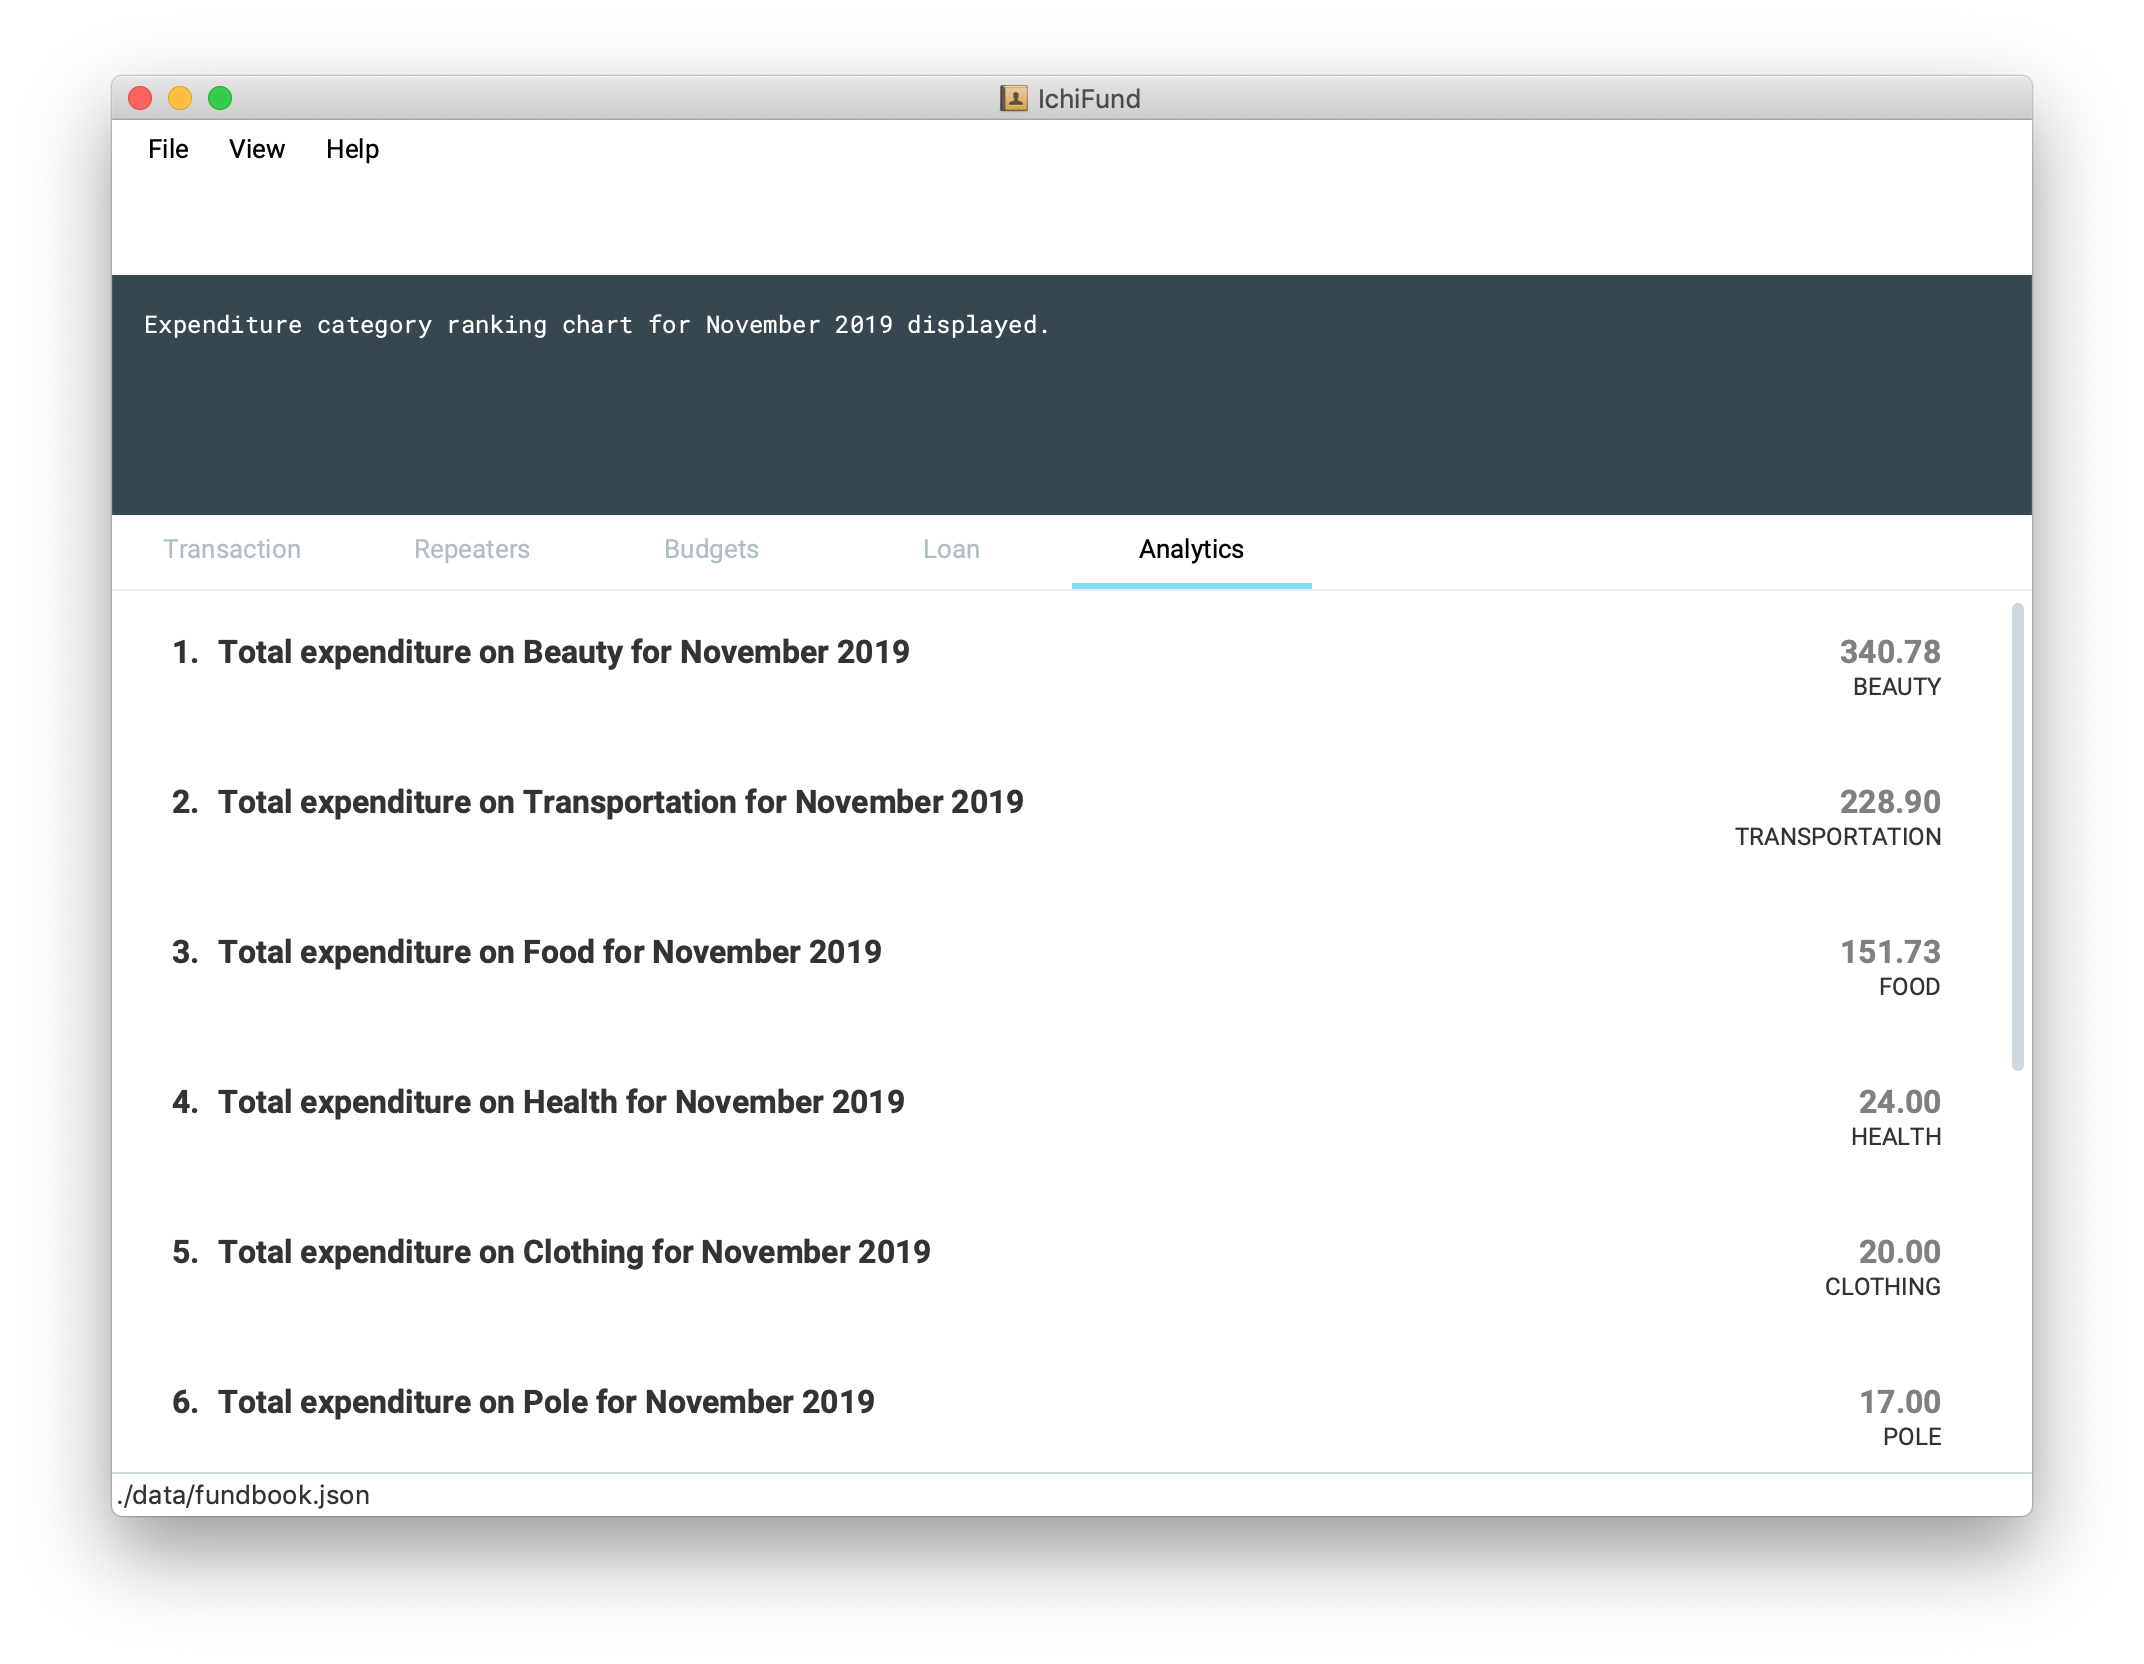
With the catrank command, you are now able to identify that it must have been the trips to the beauty salon
and the Grab rides you take on a daily basis that have contributed to your overspending, and that perhaps you should
consider painting your own nails and taking public transport to school instead.
Examples:
-
catrank
Displays expenditure category ranking chart for current month. -
catrank m/7 y/2019
Displays expenditure category ranking chart for July 2019.
Viewing expenditure ranking chart by month: mthrank
Format: mthrank [y/YEAR]
If you have a tendency to overspend in certain seasons or on certain occasions, with the mthrank command, you can look
at your expenditure ranking chart by month, swiftly identify the months that you spend most in and take steps
to reduce your expenditure in the same few months in the years to come.
| The expenditure ranking chart by month is in decreasing order, i.e., the months with higher expenditure will be at the top of the list, and the months with lower expenditure will be at the bottom of the list. |
Let’s say you have always planned overseas trips over the summer break. After entering the mthrank command,
the GUI of IchiFund may look like this:
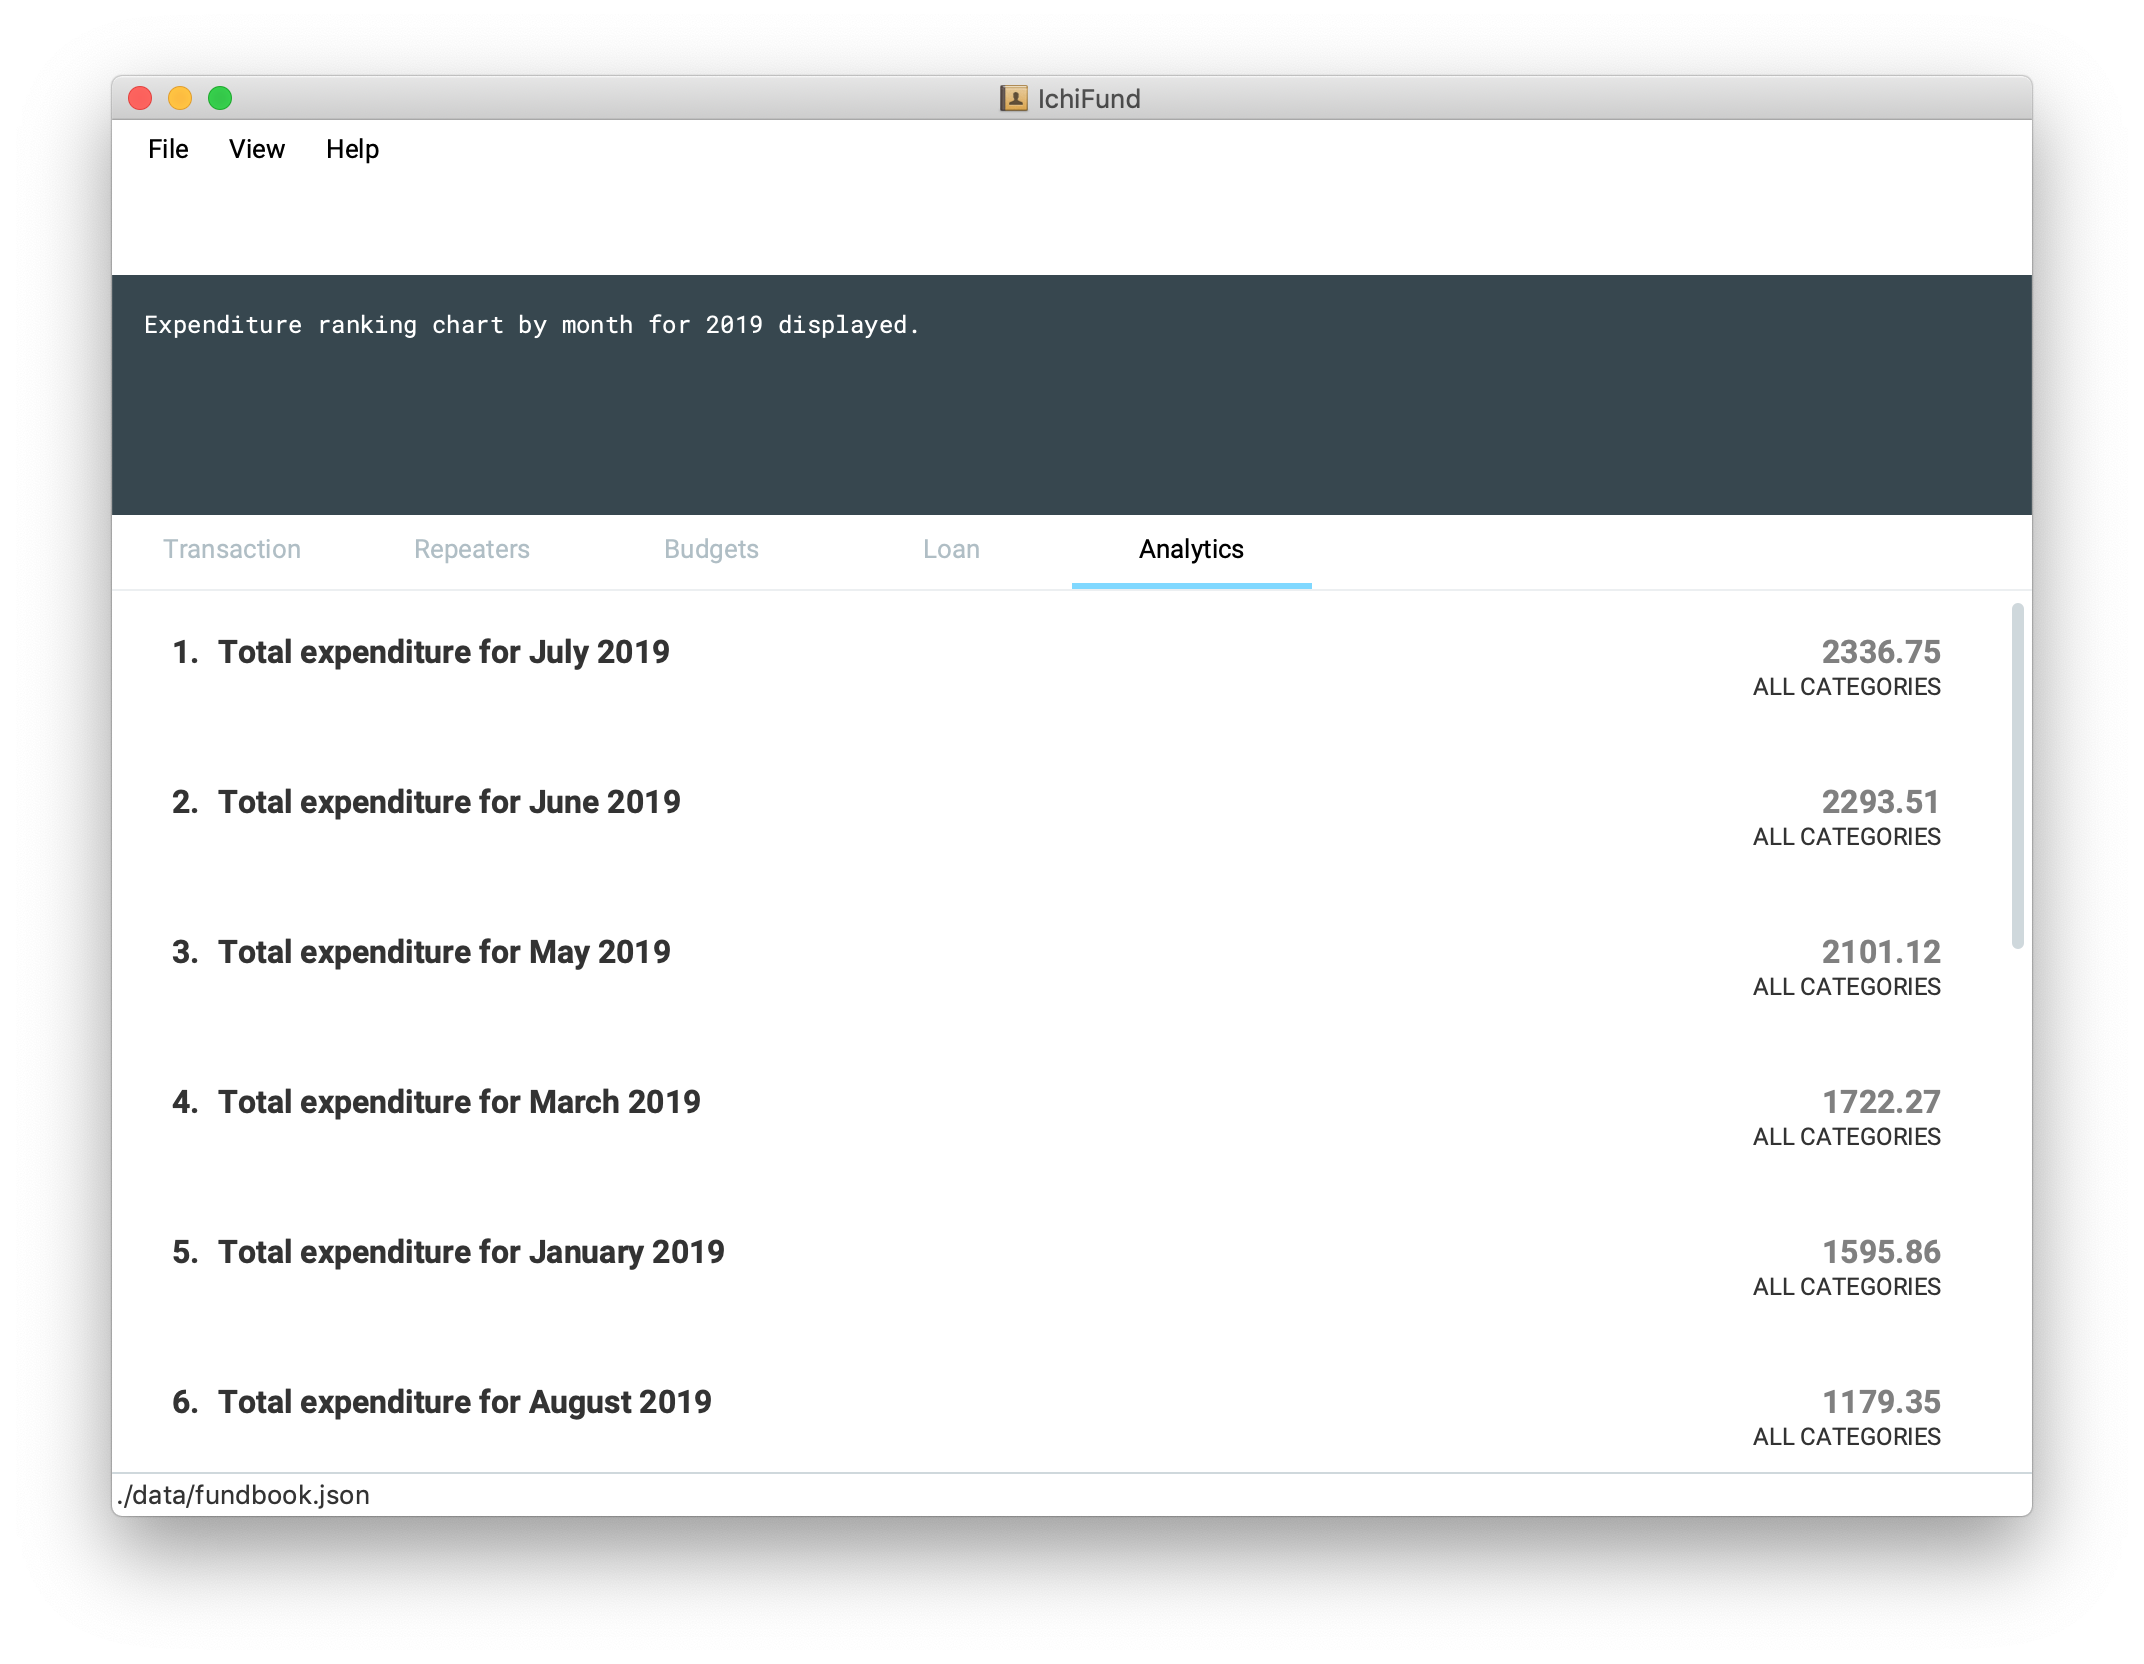
You are now aware that the expenditure on and during these overseas trips are burning a hole in your pocket, and can take measures to set a budget before going on these trips or reduce the frequency of such trips.
Examples:
-
mthrank
Displays expenditure ranking chart by month for current year. -
mthrank y/2019
Displays expenditure ranking chart by month for 2019.
Contributions to the Developer Guide
Given below are sections I contributed to the Developer Guide. They showcase my ability to write technical documentation and the technical depth of my contributions to the project. |
Analytics
Overview of the Analytics Model
Implementation
Analytical data in IchiFund is represented using the Data class. Objects of the Data class are immutable in the
internal structure. The following class diagram summarizes the details of the Data class:

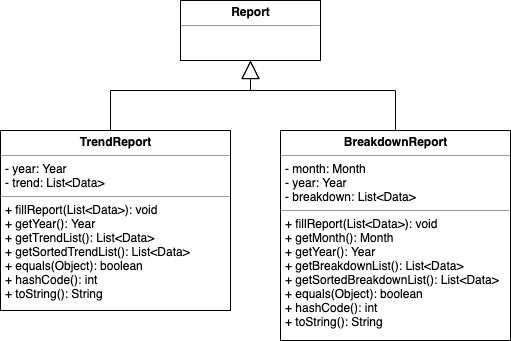
In addition, analytical data associated with a command is initially stored in a Report. Using polymorphism, this report
is initialised as either a TrendReport or a BreakdownReport depending on the command that was executed.
The following class diagram summarizes the details of the Report class:
View Expenditure Trend
The view expenditure trend feature allows the user to view monthly expenditure trend for a year.
This feature is facilitated by AnalyticsFeatureParser, ExpenditureTrendCommandParser, and ExpenditureTrendCommand.
The argument supported by this feature is:
-
Year(optional)
Implementation
After the user inputs the expenditure command in the Analytics tab, the following chain of operations occurs:
Step 1: The IchiFundParser will delegate the parsing of the command to AnalyticsFeatureParser if the current active tab is Analytics.
Step 2: The AnalyticsFeatureParser will delegate the parsing of the arguments to ExpenditureTrendCommandParser.
Step 3: ExpenditureTrendCommandParser#parse() will take in a String input consisting of the arguments.
Step 4: This arguments will be tokenized and the respective models for each argument are created.
Step 5: If the parsing of all arguments are successful, a new ExpenditureTrendCommand is returned back to LogicManager.
Step 6: The LogicManager executes ExpenditureTrendCommand#execute().
Step 7: The model is updated with the List of Data from the newly created TrendReport.
The above sequence of events is shown in greater detail in the following sequence diagram:
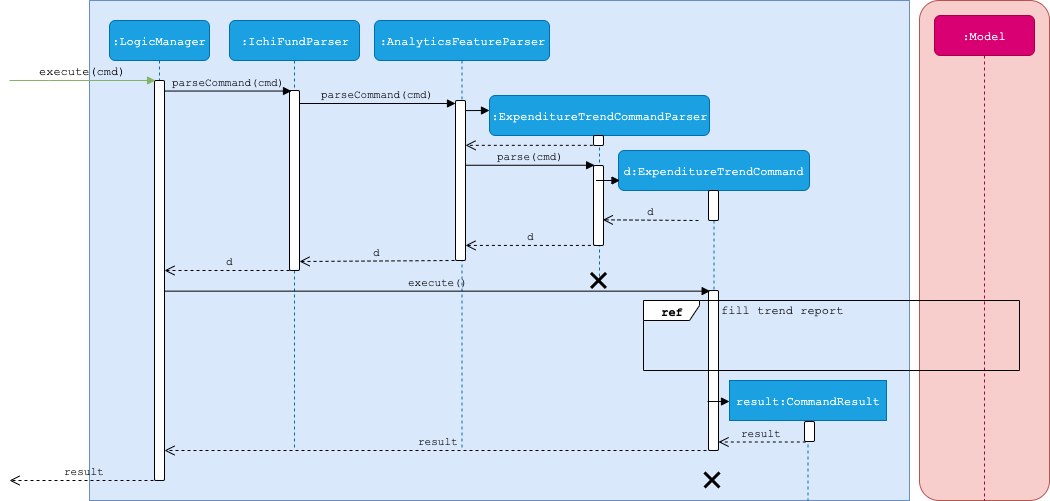
ExpenditureTrendCommandThe details of the fill trend report interactions have been omitted from the diagram above, and are shown in the following separate sequence diagram:
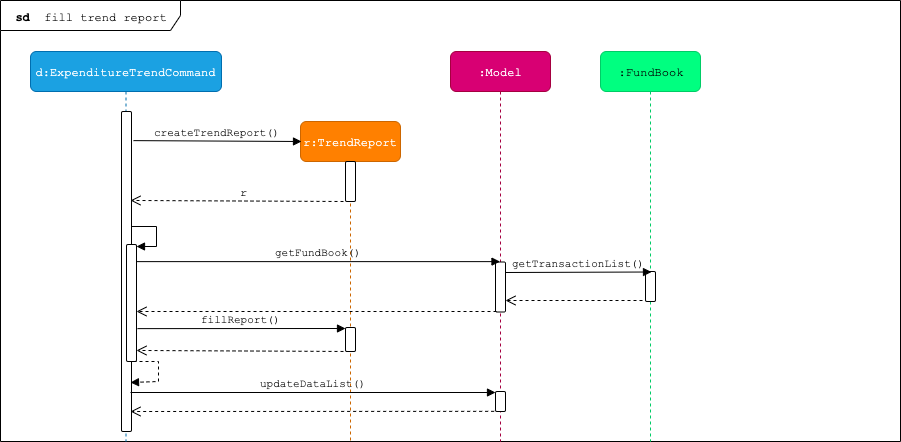
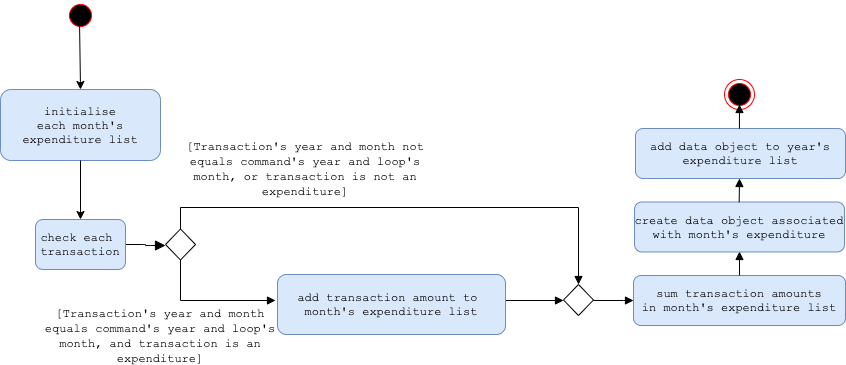
fill trend reportIn addition, this activity diagram shows the action sequence for one iteration of the internal for-loop for the
execution of the fillExpenditureTrendReport method of an ExpenditureTrendCommand.
fillExpenditureTrendReport methodView Balance Trend
The view balance trend feature allows the user to view monthly balance trend for a year.
This feature is facilitated by AnalyticsFeatureParser, BalanceTrendCommandParser, and BalanceTrendCommand.
The argument supported by this feature is:
-
Year(optional)
Implementation
When the user input the balance command in the Analytics tab, the following chain of operations occurs:
-
The
IchiFundParserwill delegate the parsing of the command toAnalyticsFeatureParserif the current active tab is Analytics. -
The
AnalyticsFeatureParserwill delegate the parsing of the arguments toBalanceTrendCommandParser. -
BalanceTrendCommandParser#parse()will take in aStringinput consisting of the arguments. -
This arguments will be tokenized and the respective models for each argument are created.
-
If the parsing of all arguments are successful, a new
BalanceTrendCommandis returned back toLogicManager. -
The
LogicManagerexecutesBalanceTrendCommand#execute(). -
The model is updated with the
ListofDatafrom the newly createdTrendReport.
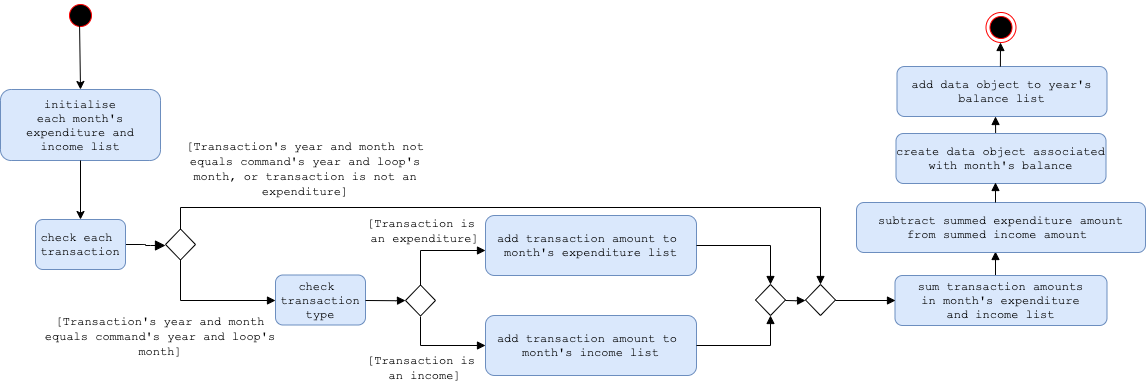
Observe that the implementation of balance differs slightly from that of expenditure and income.
|
The following activity diagram shows the action sequence for one iteration of the internal for-loop for the
execution of the fillBalanceTrendReport method of an BalanceTrendCommand.
fillBalanceTrendReport method